SITE ANALYSIS

Your Project Deserves Better Than Google Maps
Instant Download - Council Ready

Gain Detailed Real-World Insight

Site Analysis provides instant context with up-to-date, high resolution aerial photography and micro-climate analysis.

Choose your site location and size – readily available for most urban areas in Australia!

  • Up-to-Date
  • Georeferenced
  • High Resolution
  • Instant Download
  • Project Based - No Subscription
  • Customisable Location and Size
  • NEW: Cadastre Property Boundaries
DXF

CAD Ready

DXF Importable Cadastre Lot Building

Gov Pixels 2

Backed By Government

Accelerating Commercialisation AUSIndustry Programme

Australia

National Coverage

For 90% of Urban Areas in Australia across All States and Territories

How It Works

1
Select Site and Make Order
Site Analysis is available for most urban areas in Australia. Follow these 3 simple steps: select a site, size, and other options such as historical images, and make an order.
 
✔ Select Location and Size
✔ Choose Further Options
✔ Order and Payment Checkout
2
Instant Analysis

Site Analysis aggregates and processes multiple data layers including high resolution aerial imaging to ensure you get the latest data available.

✔ Latest photography from MetroMap
✔ Automated Data Fusion and Analysis
✔ Quick Processing Time

3
Delivery
Your Site Analysis is available for download within a few minutes after its ordered. Download easily your Site Analysis and plans as pdfs and geotiffs via Dropbox.
 
✔ Delivered Within Minutes of Order
✔ Email Notification
✔ Download Site Analysis Package

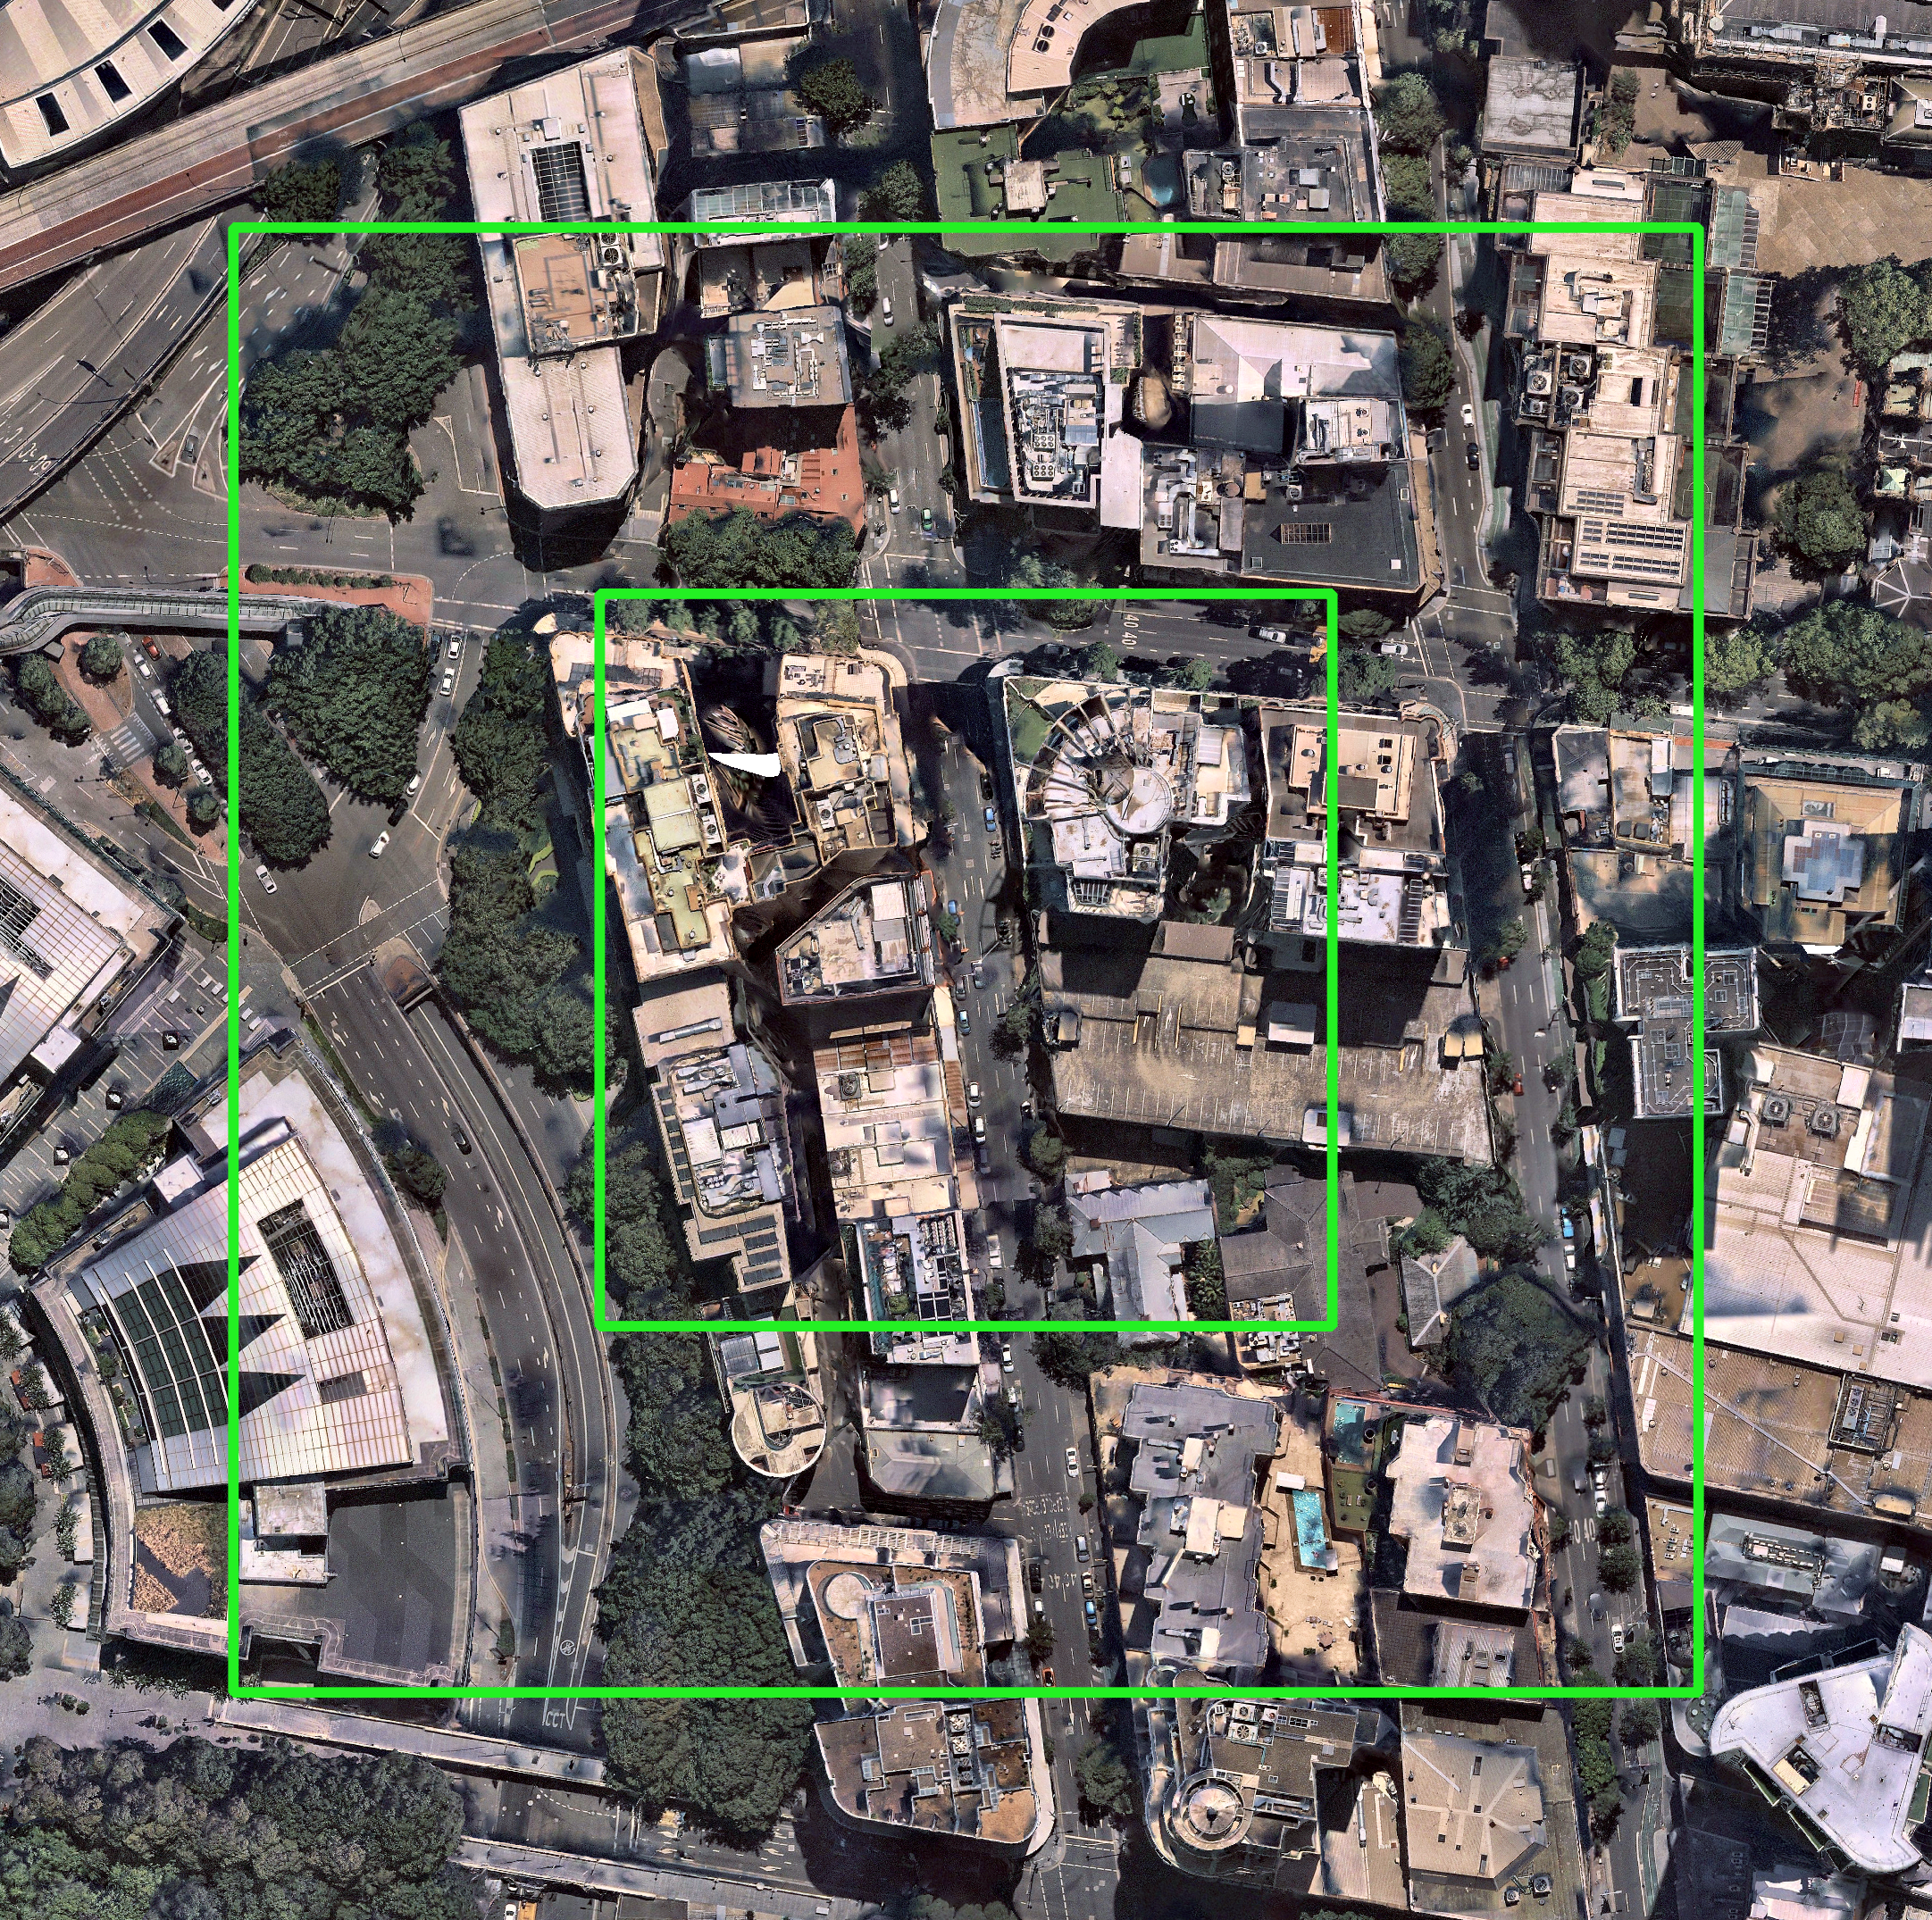
Site Analysis Features
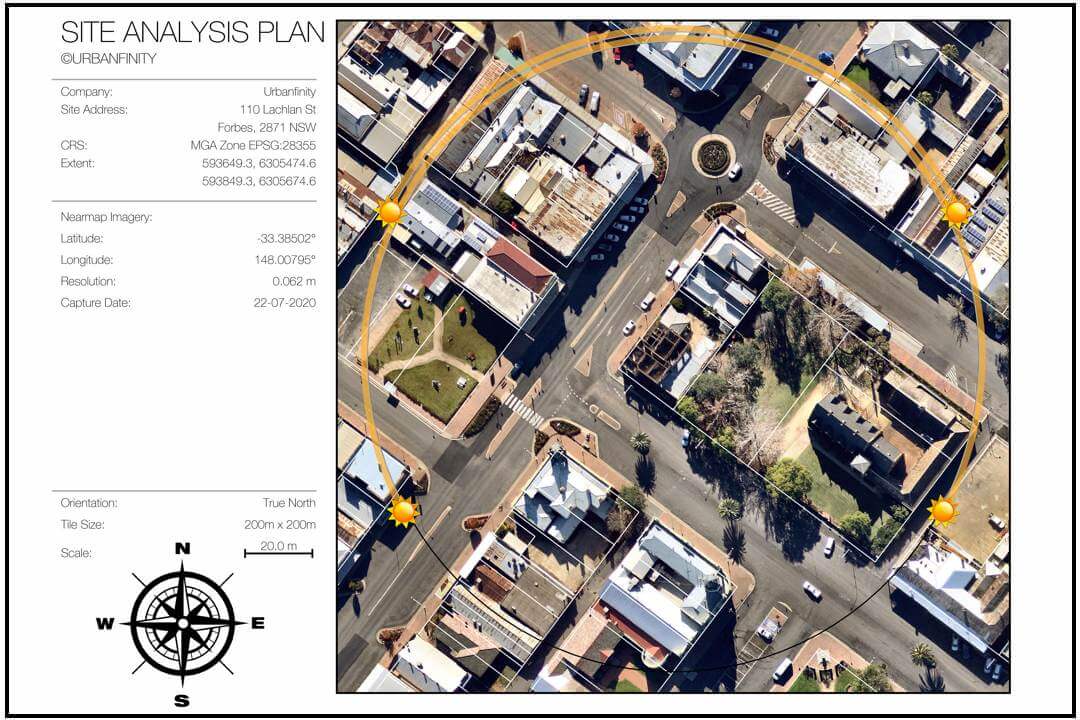
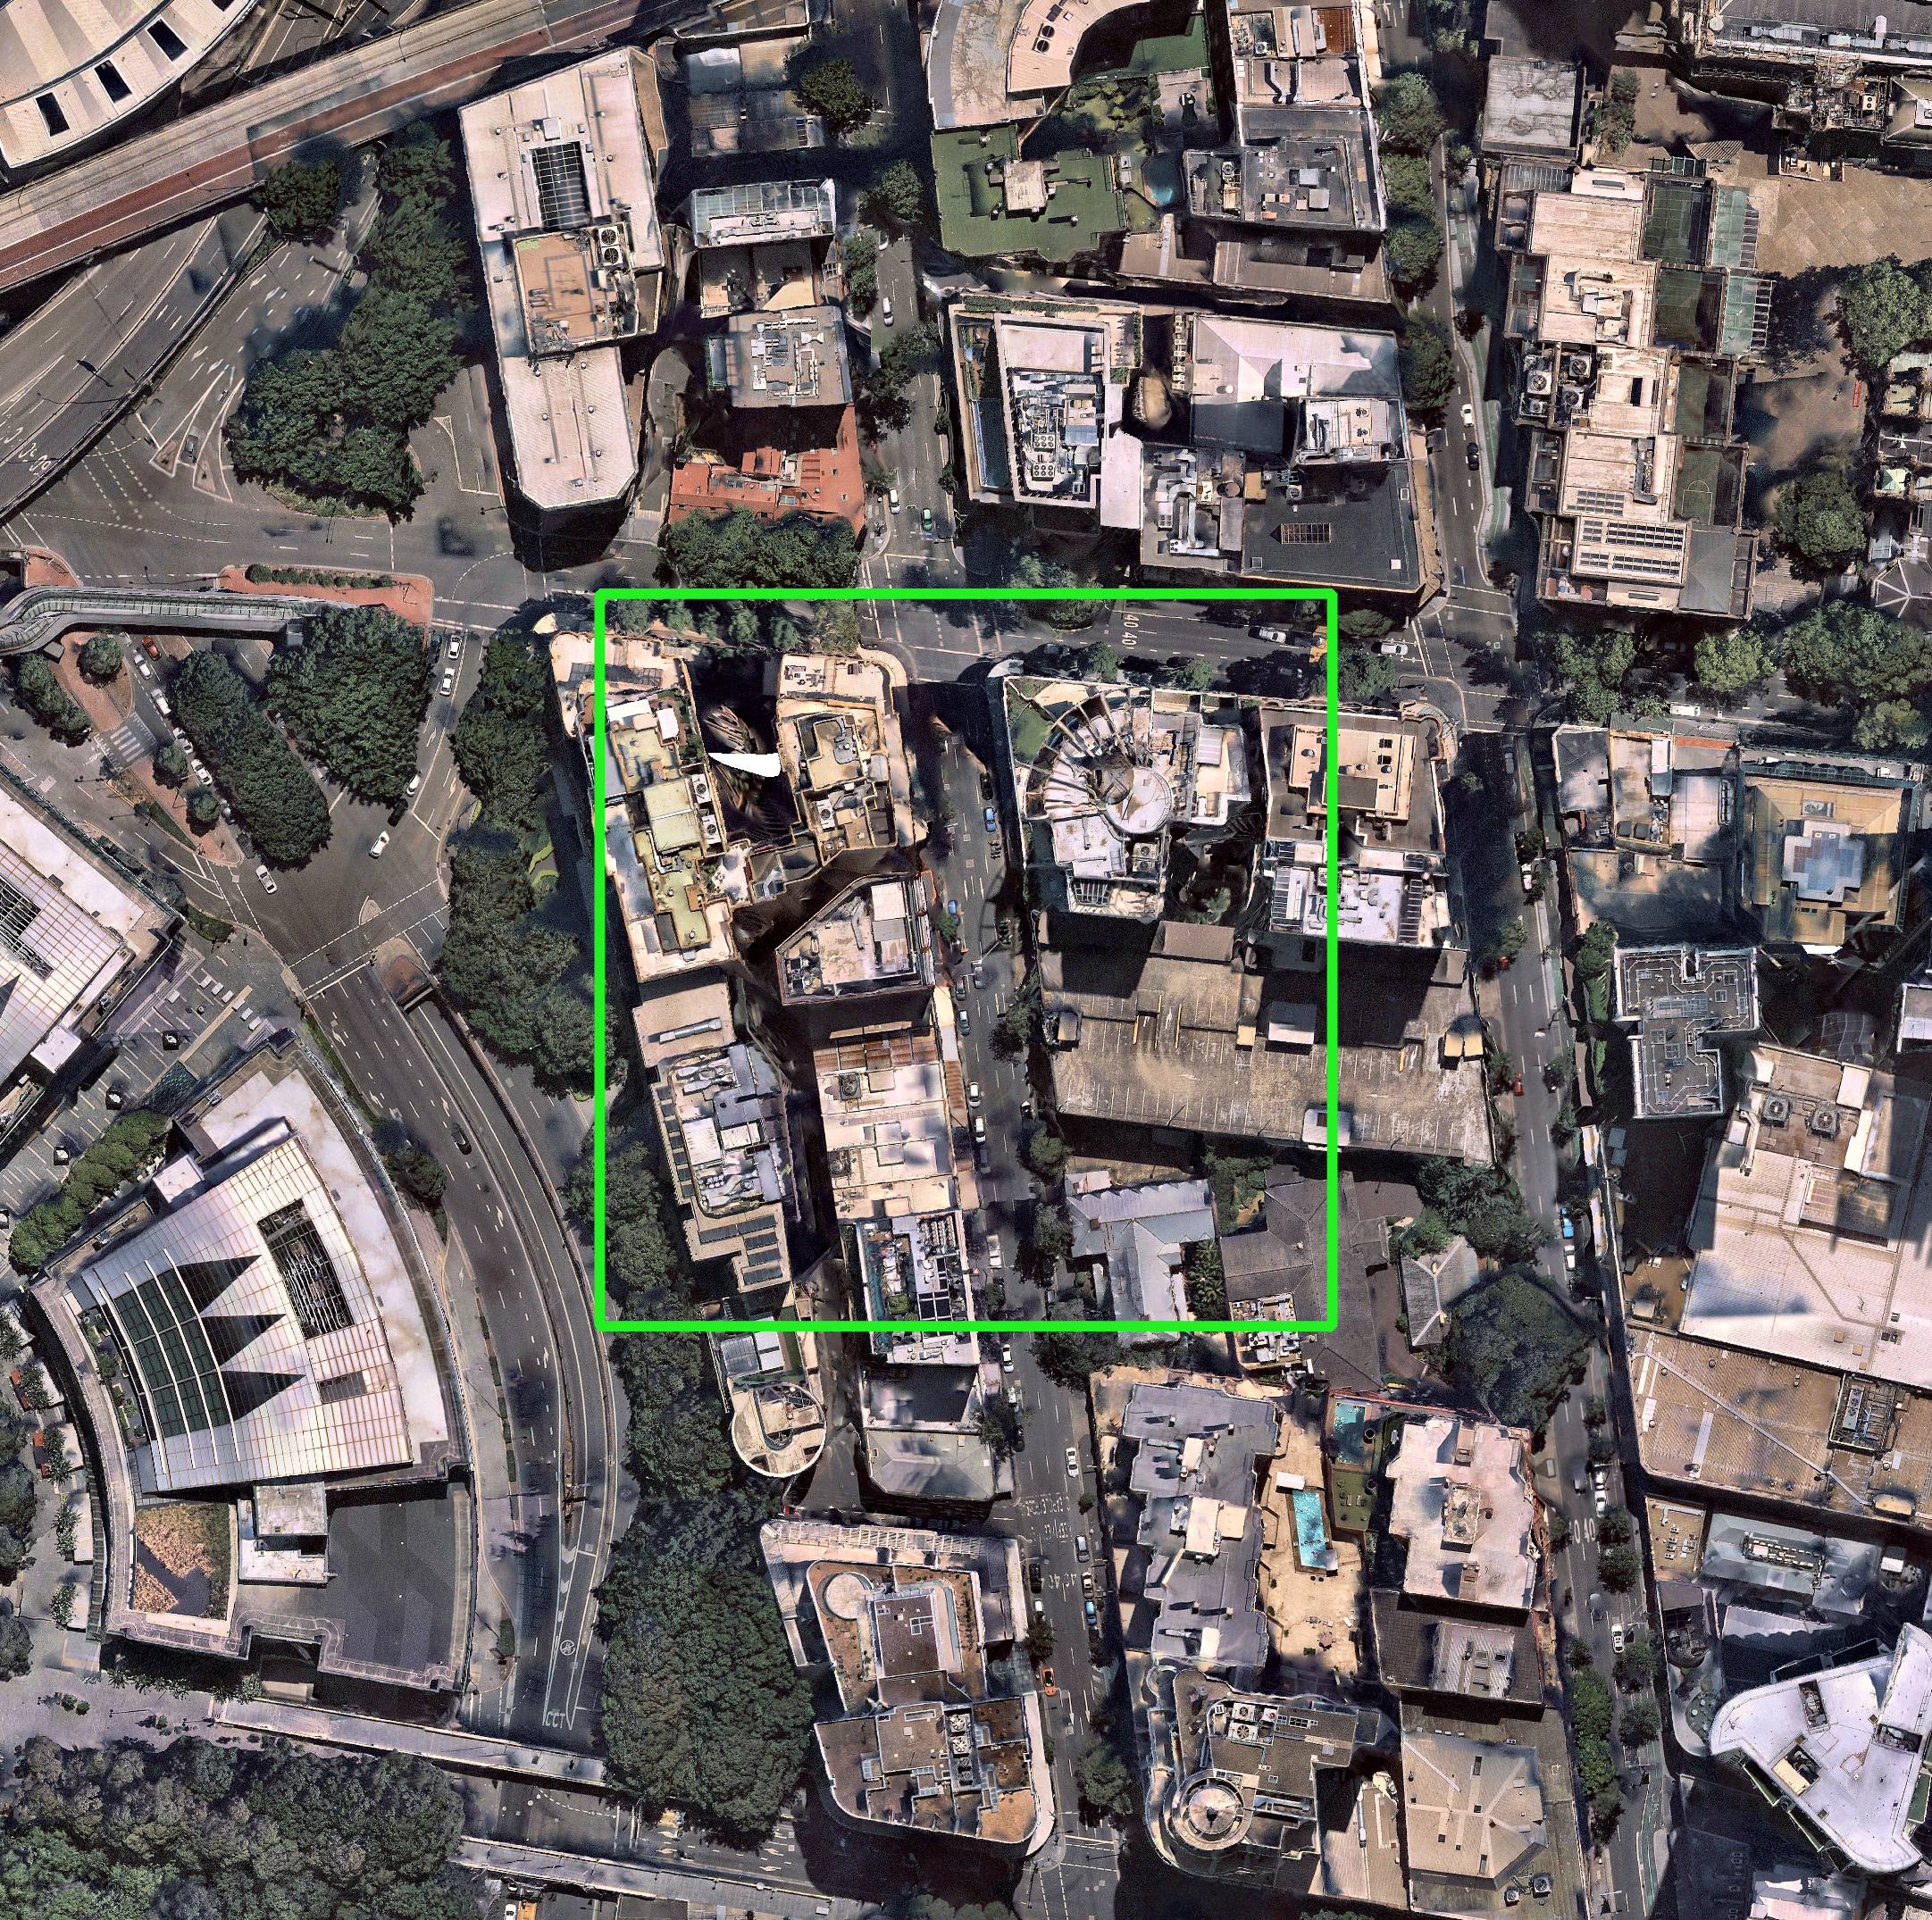
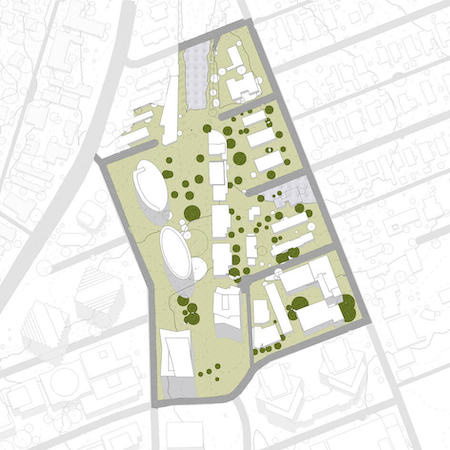
siteanalysisplan_rec_comp

Site Plan

• Detailed View of
Real-World Context

• Sun Swepth Paths for Solar + Shading Analysis

• Cadastral Boundaries (NSW, QLD, VIC, ACT) and DXF File

• Referenced by Exact Date and Geolocation; Optional Historical Images

high fidelity imagery-1

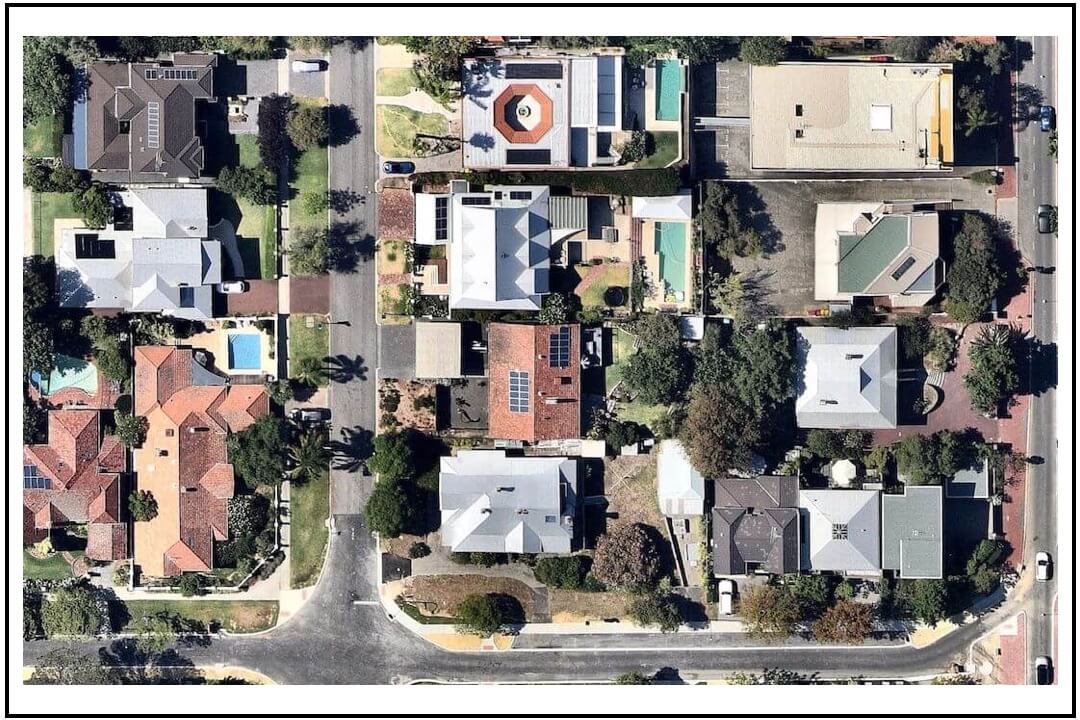
High Fidelity Imagery

• Reliable High Resolution
(5 to 10cm)

• Frequently Updated by MetroMap
(typically 2 to 6 months)

• Ultra Clarity and Uniform Ortho-rectified Scale for High Fidelity Measurements

• Geo-tiff Format for
Universal CAD/GIS Import

siteanalysis_rec_comp

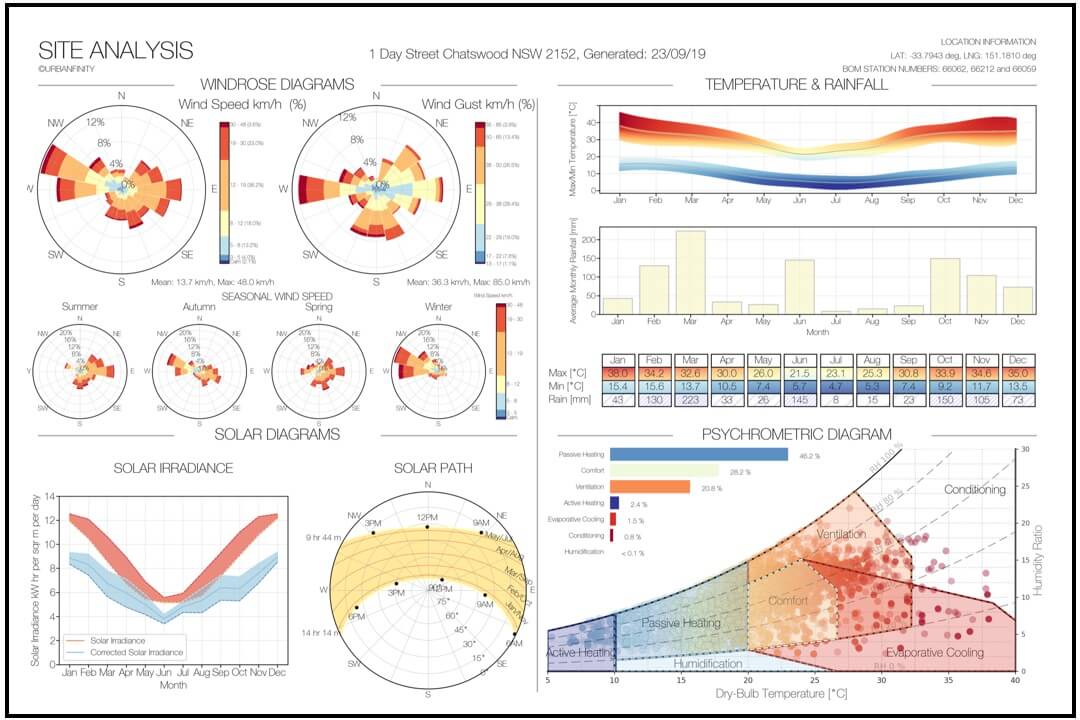
Terrain & Topography

• Solar Analysis incl. Solar Paths, Irradiance, and Cloud Cover

• Windrose Speed + Gust

• Temperature + Rainfall

• Psychrometric Analysis for Comfort Design Strategies

Affordable Project Based Pricing

Fixed prices, no subscription required. High resolution imagery and analysis for your project instantly.

$45 + GST

Up to 125m Tile Size

NEARMAP_125-1


Up to 500m

Price will vary depending on Tile Size

NEARMAP_250_125


Industries

From architecture to landscaping to solar roofs, Site Analysis power today's industry and community to bring accurate and real world insight to your project.

indimg_ARCHITECTURE

Architecture & Engineering

Jumpstart your project design with the latest aerial measurements and geo-referenced tiles as CAD layers. Leverage climate analysis to guide your design strategies and Site Analysis Plans.


indimg_CONSTRUCTION

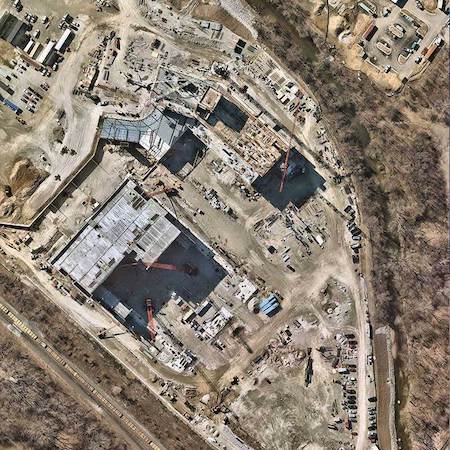
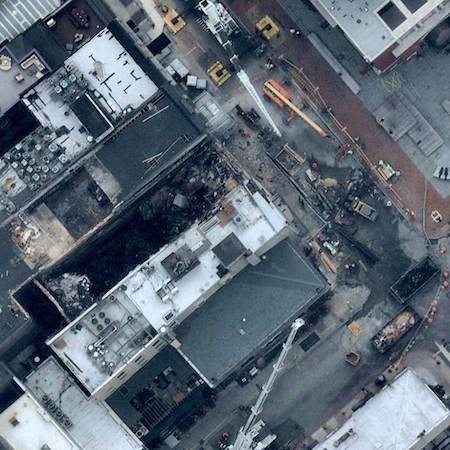
Construction & Safety

Anticipate safety equipment needs, estimate material requirements, plan vehicle access points, and determine crane clearance requirements.


indimg_PROPERTY

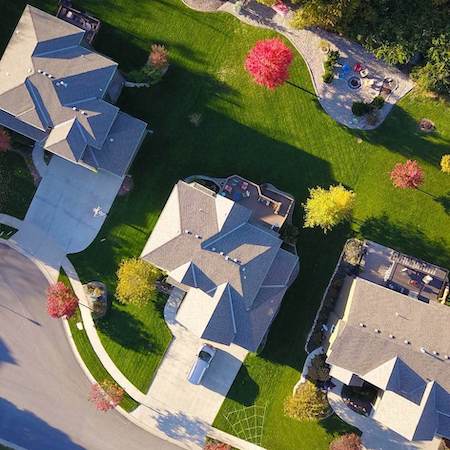
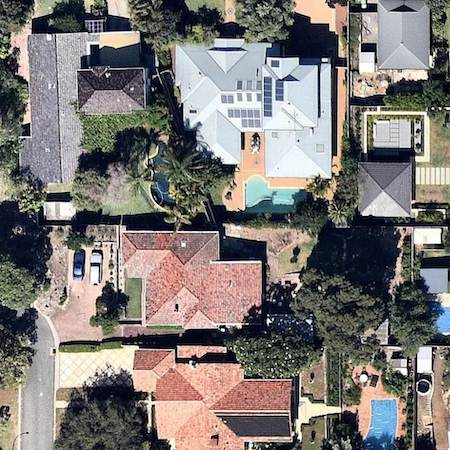
Property & Real Estate

Verify and measure property details in real time, and add value with clear, beautiful imagery that accurately reflects the current state of the site.

indimg_LANDSCAPE

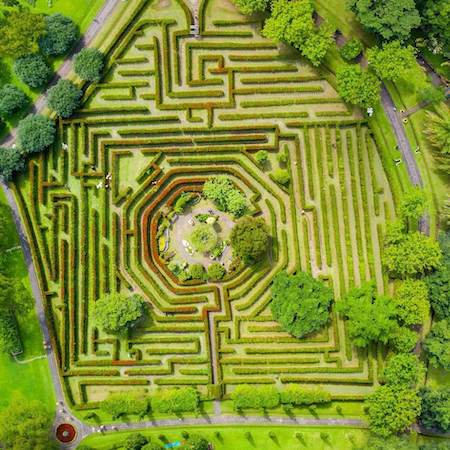
Landscaping & Gardening

Use high resolution, up-to-date aerial imagery to measure areas, and climate requirements to communicate your ideas with your team or clients.

indimg_ROOF

Roof & Solar

Inspect roof conditions, shading, and solar irradiance, develop breath-taking proposals, and anticipate safety and roof access needs.

indimg_RISK

Risk & Insurance

Verify property details remotely to resolve inquiries, use historical imagery with clear aerial photos referenced by exact date and geolocation.

How To Create Site Analysis Plans Instantly

Frequently Asked Questions

Q1. What is Site Analysis useful for?

A. Site analysis provides a detailed map of a customisable location, providing a reliable and detailed basis for further design purposes in a multitude of industries. The provided historical data, infrastructural context and accurate climate analysis can all be instantly processed.

Q2. What areas are covered and how often are the images updated?

A. We are focusing on currency, consistency, coverage, and ease of access to aerial imagery data. Images are regularly updated covering 90% of the Australian population - with more than 100 urban areas encompassing more than 130, 100 unique square km annually, and growing. Update frequency is typically six times a year for metropolitan areas, at least 3 times a year for most urban areas, and at least once a year for selected populated regional areas. Images are available on our platform within days of capture.

Q3. What is the resolution and accuracy of the images?

A. With clear vertical and industry-leading resolution of 5cm-10cm, you can perform detailed analysis of your sites. The absolute horizontal accuracy is 15cm-25cm, measured as root mean square of the radial distance error (RMSE) with a measurement precision of 15cm within one photo. Cadastre data is currently available for NSW, VIC, QLD, and ACT. Site Analysis uses original data provided by our Data Sources.

Q4. What geo-reference system and orientation is used?

A. The Site Analysis Plan is provided in the respective projected MGA Zone as indicated on the pdf and corrected for True North orientation. The geo0tif includes the coordinate reference system and the cadastre geojson is provided in WGS84 (ESPG:4326). Both files can be edited in any common GIS program (e.g. QGIS or esri ArcGis) or inspected with online tools.

Q5. When can I expect the order and how will I receive it?

A. The site analysis product is fully automated and delivered instantly within a few minutes after ordering. Shortly after the invoice has been sent, you will receive an additional email with the download information. In case you haven't received any download notification after 10 minutes, please check your spam folder (sender: service@siteanalysis.ai) or contact us directly via email.

Q6. Can I preview the order?

A. To give you the opportunity to study our product before purchase, we provide you a sample of the Site Analysis product here: Download Sample

Q7. What if I ordered by mistake?

A. We have put in place a mechanism for you to review and to confirm the order before payment. Unfortunately one the order is in we have the obligation to pay a third party provider for the imagery data, which we are unable to reimburse. However, we are happy to review your feedback and we are there to help you.

Q8. What if I need a bigger size than 500m?

A. We are always looking into ways to improve our product and to offer more options including expanding the maximum size. If you are currently looking for a custom size please contact our service team at service@urbanfinity.com.au and we are happy to help you.

Q9. What if I'm unhappy with the order?

A. We provide a free sample for you to download. The sample will demonstrate the product you will receive. We hope that the sample will meet your expectations and welcome any feedback or questions you may have in regard to the accuracy and quality of our product. If you are unhappy with the image quality please send us an email to review the image data. IN some instances there may be a slight variance between the cadastral and the imagery data on the pdf. We produce in addition to the pdf, the original data as geotif, geojson, and dxf, which can be aligned using any common CAD or GIS software (not included in our service). We are here to help! If you have any questions please contact our service team at service@urbanfinity.com.au 

Q10. What are GeoJSON files?

These are geosnatially referenced and can be used in geospatial programs such as ArcGIS and QGIS, these are geo-referenced shape files.

Compared to DXF files GeoJSON files can be easily imported via drag and drop into any common Geospatial program (free) and ESRI ArcGIS, and automatically overlaid with other geospatial layers.